
Canvas New Analytics
Learn how to use Canvas New Analytics to see how students are doing in your course
By Gwenna Moss Centre for Teaching and LearningTeaching online can feel like we are teaching in a vacuum. Without the usual cues that face-to-face teaching provides, it can be difficult to tell whether students are engaging or participating with their course materials. Even if you feel like you have a good sense of how your students are engaging with the course, New Analytics can help confirm your intuition.
What is New Analytics?
New Analytics is a tool that can track and report student activity within Canvas. Student activity is defined by two data points: Page Views and Participations. The table below shows the difference between the two.
| Page View | Participation |
|---|---|
| Tracks each time a request for a page is sent to the Canvas server, so this number is likely to be greater than the actual numbers of page views. Page views should be seen as an approximation of student activity and not an absolute metric. |
The following are counted as participations in Canvas data:
|
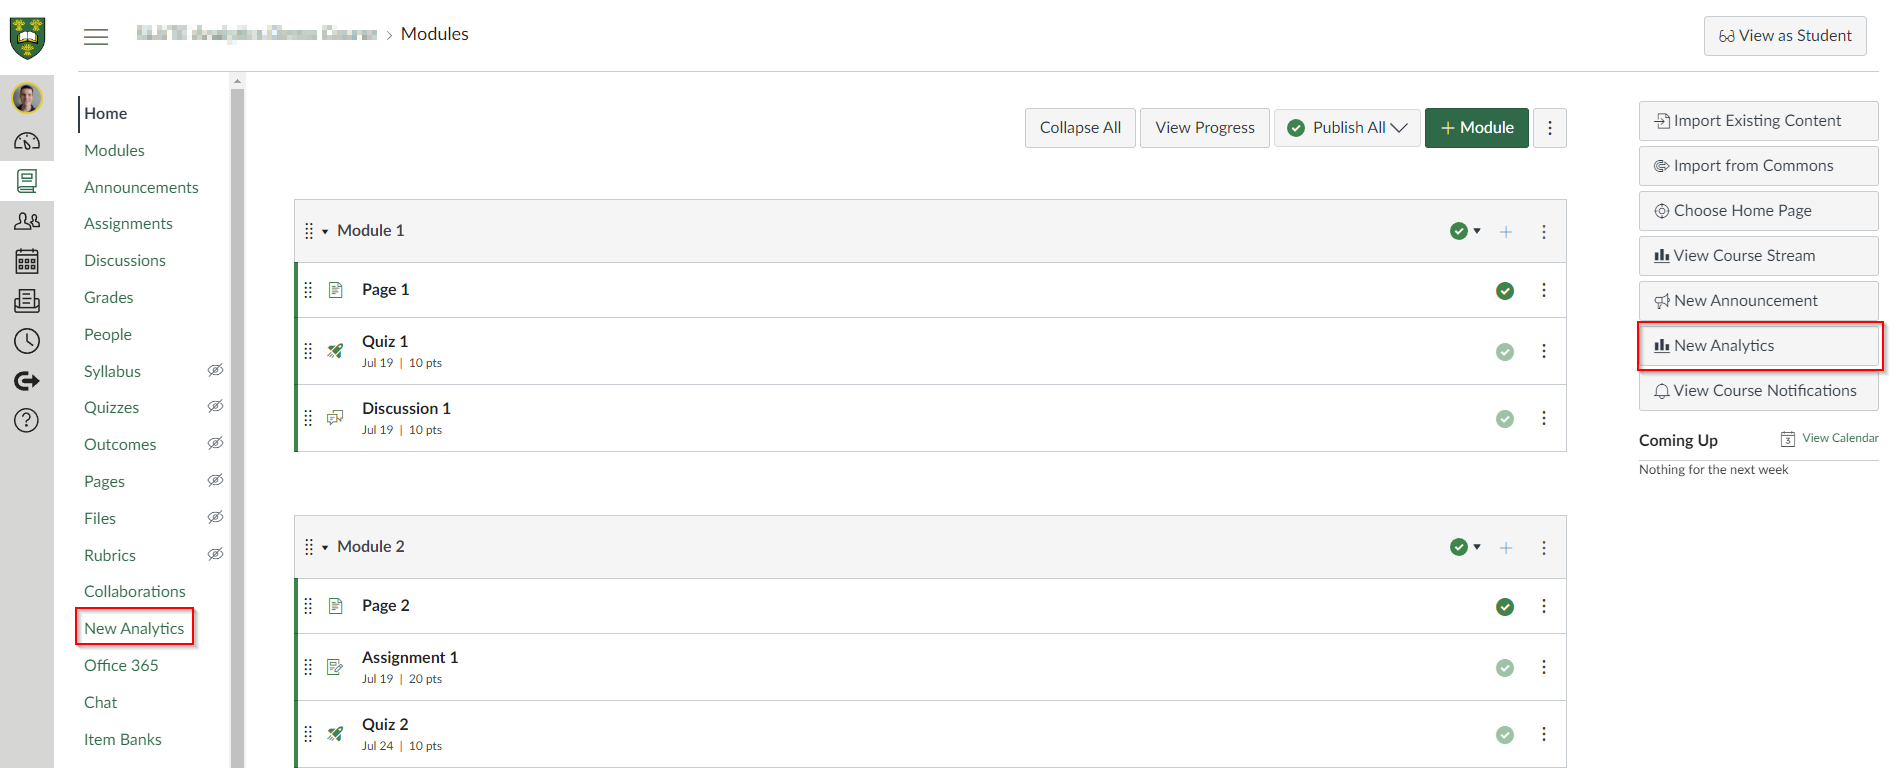
Accessing New Analytics
You can easily access New Analytics through the course Home Page or from the course navigation menu (if you have set it to be visible in the menu).
Using New Analytics
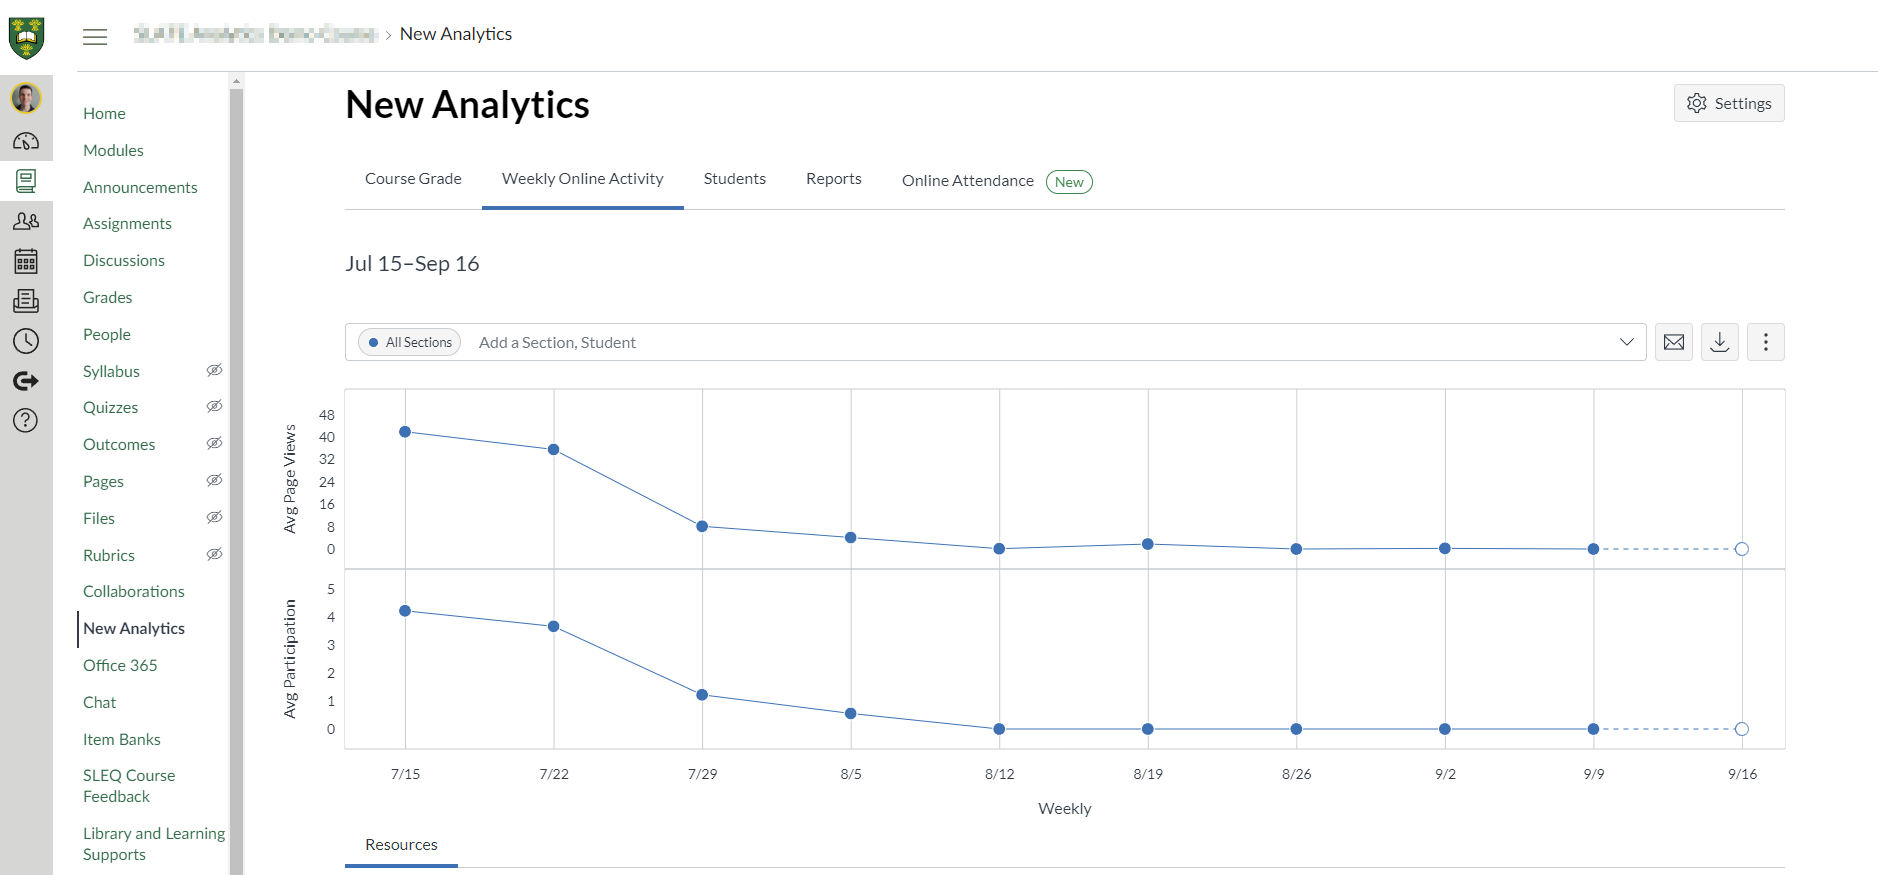
You can use New Analytics to view and compare several items such as average course grades, which shows if students are keeping up with their assignments, and see the average weekly online participation which shows if students are engaging with the course material. Using these analytics can help you to identify students who might benefit from additional support based on their course grades or participation criteria.
Once these students have been identified, you can send targeted messages to their Canvas Inbox. By sending a personal message to your students, you are showing them that you care and are available to help them with any issues they are experiencing. If you prefer, you can also send emails. For instructions to generate a list of student emails using New Analytics, watch this video.
New Analytics also generates reports on missing, late, or excused assignments, class roster, and course activity that can be easily viewed and downloaded.
Viewing particular students
If you want to know how a particular student is doing in your course, you can access New Analytics for individual students or the Course Access Report for that student. The access report will show you:
- The content the user has viewed.
- The number of times the user viewed the content. A view is counted each time a user navigates to the URL where the content resides or downloads an attachment.
- The number of times the user participated (if applicable, such as posting to a discussion or submitting an assignment).
- The last time the user viewed the content.
You can also access a student’s Interaction Report where you can:
- view the last time you interacted with the student
- see the current grade for that student
- see if there are any submitted but ungraded assignments for the student
- quickly access the Conversations page to send a message to the student by clicking the message icon.
- Course statistics give a glimpse into which assignments, discussions and quizzes are engaging students and what might be improved in the future, knowing this helps you to better engage your students.
Good to Know:
- Page views and participation metrics include an aggregate across all devices (i.e., desktop, mobile).
- Data is refreshed in New Analytics every 24 hours – so check the time the data was last updated in the course, as content may be outdated compared to recent course activity and student submissions.
- Only active and completed student enrollments are included in data for New Analytics. Deleted or inactive user enrollment will not generate data.
If you find yourself wondering whether students are looking at your course, engaging with the content or keeping on top of the coursework, a glimpse into the New Analytics and Course Statistics is a good place to start. If you find that students are not engaging or are falling behind – reach out to them. It could make the difference between them completing the course or not.
This article describes the features of Canvas New Analytics, but does not include many suggestions for how to apply these features well in your teaching, including ethical considerations.
If you are interested in using more data to inform your teaching, consider registering in our short course, SLATE: Structured use of Learning Analytics for Teaching Enhancement. If there are no current offerings, email gmctl@usask.ca to express your interest.