How do we know that our decisions are supportive of and responsive to the needs of our students? By using data to inform decisions and designs, we use our resources as effectively as possible to ensure that all students are as successful as they can be, regardless of their unique circumstances. This is where learning analytics come in.
Learning analytics is the measurement, collection, analysis and reporting of data about students and their contexts, for the purposes of understanding and improving the quality of learning and teaching and the environments in which these actions occur.
Student data for learning analytics is defined as that data which is created, collected, or stored by the university and which could pertain to students’ academic activity.
Our Learning Analytics Context
At the University of Saskatchewan, our approach is to gather information about our students’ academic performance as well as demographic and activity data that could pertain to learning success. In line with the institution's Learning Charter commitments, this data will be used to connect students with appropriate academic supports and services, to personalize their learning experience, and to improve our academic programs.
Learning Analytics work is conducted under the leadership of the Office Teaching and Learning in partnership with Information and Communications Technology, Student and Enrolment Services and the Gwenna Moss Centre for Teaching and Learning.
Policies and procedures to ensure proper use of student data and to protect learner privacy are in place and detailed toward the bottom of this page.
Learning Analytics Tools
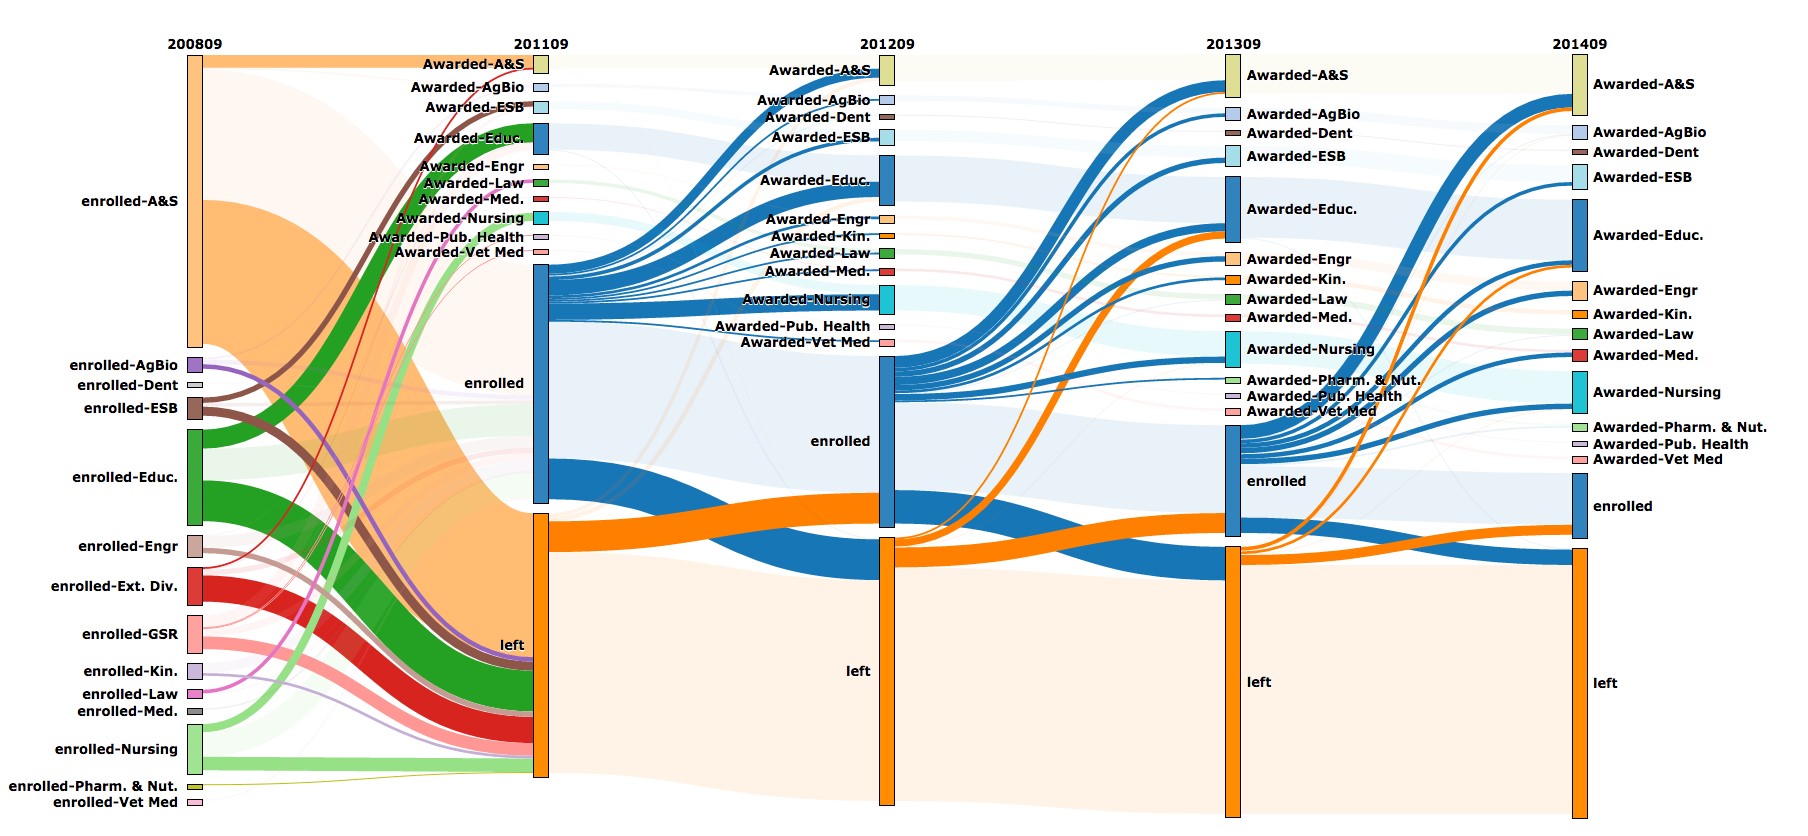
The Ribbon Tool is a visualization tool used in partnership with universities associated with the BayView Alliance. For students in an academic program, the tool allows us to see how groups of students flow between programs throughout their time as students, including students who leave the university without completing their programs.
Questions This Answers
- What does attrition and retention look like in our department? Where do students come from and where do they go?
- Based on where our students end up, is there something we can be doing in our courses to better equip them for success?
- Do our programs affect different groups of students differently?
Strengths
- Identify demographic groups of students in an academic program whose paths differ noticeably from other groups, which can point to specific points in the program that may need more attention.
- Interactive interface allows users to click into specific segments of the visuals to learn even more about how students move into and out from the program.
- Tracking the same group of students over time is not something that can be done using most other university analytics tools.
Limitations
- Views are across longer time scales, meaning it is difficult to isolate a specific event or intervention in this tool.
- Data is visualized without additional context, so it relies on the reader to have good pre-knowledge of the program to make meaning of the visualization.
Ribbon Tool - Video Tutorials
Watch this series of videos to help further your understanding of the Ribbon Tool:
- Part 1: Basics
- Part 2: Filters
- Part 3: Expand and Isolate
- Part 4: Hierarcy and Grouping
- View the full video series
To view the video tutorials, you will be asked to enter a valid USask NSID.
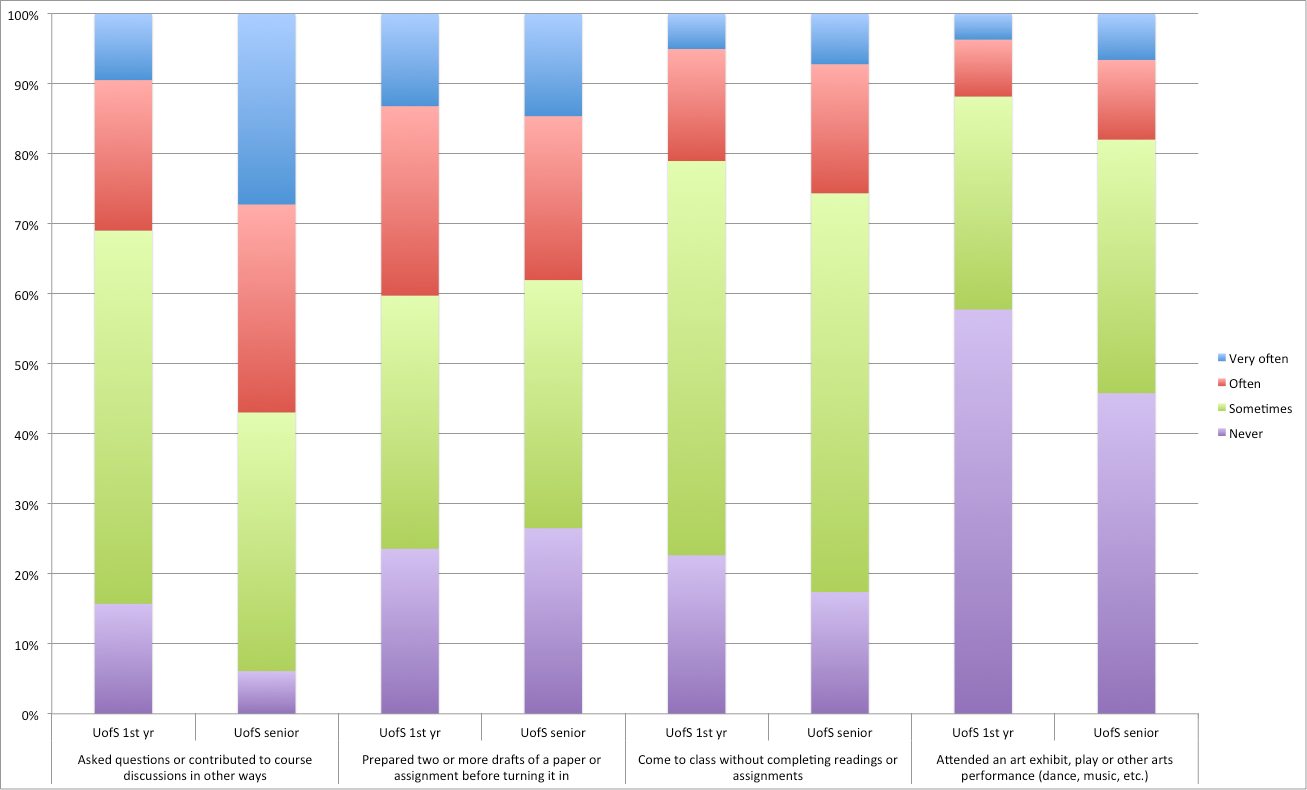
Every three years the University of Saskatchewan participates in the National Survey of Student Engagement (NSSE). NSSE is a standard survey sent to students at several universities across Canada, and is a helpful tool in learning analytics because it is the only one with data that extends beyond USask. College-specific NSSE data is particularly useful to units planning program revisions or teaching innovations, or preparing to complete an Academic Program Review self-study.
Questions This Answers
- How engaged are our students with their studies as a whole?
- How does the experience we offer compare within and beyond USask, in first year and in upper years?
- What actions could we take for highest impact on student engagement, in first year and in upper years?
Strengths
- Comprehensive survey that can paint a vivid picture of the student experience in your college.
- Comparisons to other universities are given, acting as a benchmark for comparison.
- Helpful to compare the first-year experience to the experiences of students in upper years.
Limitations
- Due to the standardized nature of the survey, some included items may be less relevant to our USask context or may be missing items we would find relevant.
- Frequency of our NSSE (once every 3 years) means that other tools should be used to track and assess change over smaller time scales.
Built into Canvas, our centrally supported learning management system, is a feature called New Analytics – one of the more accessible and powerful learning analytics tools we currently have. In it, instructors can analyze their class as a whole, individual students, and individual learning materials to make whatever adjustments are helpful to improve the learning environment for everyone.
Questions This Answers
- Are my students using the learning materials as intended? Are structural changes necessary?
- Which students would benefit most from outreach and support from me to be more successful in my current course?
Strengths
- Act quickly and effectively based on the data you see – for example, see students who haven’t logged in, page views, message students who haven’t yet turned in an assignment, or ones who may be getting somewhat lower grades to offer additional support.
- The only tool we have that allows you to monitor student interactions with learning materials (i.e. views and interactions) to assess whether your learning materials might need promotion or refinement.
Limitations
- Data is limited to Canvas, meaning it is necessary to consider other avenues of interacting with course materials before acting on the data in New Analytics.
- Grades features require properly setting up the relative weighting of assessments in the Assignments area of Canvas in order to work properly.
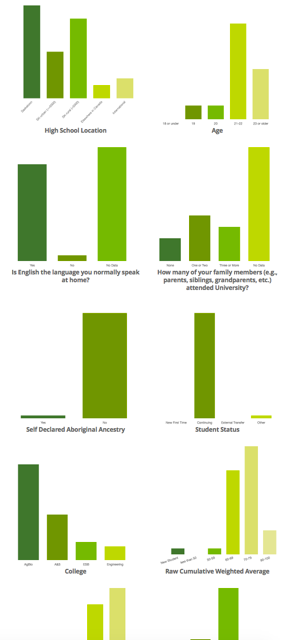
Know Your Class gives instructors an “at a glance” view of the demographic compositions of students in their courses. This allows instructors to build the learning environment specifically for their current cohort of students. For example, if an instructor is teaching a first-year course with many students who have no family members who attended university, that instructor can provide additional explanations and links to resources as those students are less likely to have family members who know about and would encourage students to seek out the supports on their own. It is accessed through Canvas.
Questions This Answers
- Beyond visible manifestations of diversity, what else makes my class unique?
- Am I making assumptions in my teaching that may disadvantage a certain group of students?
- What special supports or assistance should I be offering to my students, based on what I see in the infographic, to help them succeed?
Strengths
- Wide variety of demographic attributes (see list here) give a big picture view of who is in your class; allows instructors some insight into aspects of diversity that may not be as visible.
- Offer supports and learning activities that reflect your learners – for example, if you have students from a variety of colleges taking your course as an elective then it may be helpful to their learning if you allow more choice and flexibility in assessments to relate the course context to their major.
- See also: Strategies on how to effectively use the Know Your Class infographic.
Limitations
- Intersectional identities are not shown; you will not know how many of your students have identities that overlap between the different attributes.
- Cannot be used in courses with fewer than 10 students due to privacy of sensitive personal student data.
- It is not always immediately clear how to apply this knowledge to your teaching; consider booking a consultation by emailing gmctl@usask.ca for advice on how you could apply this information.
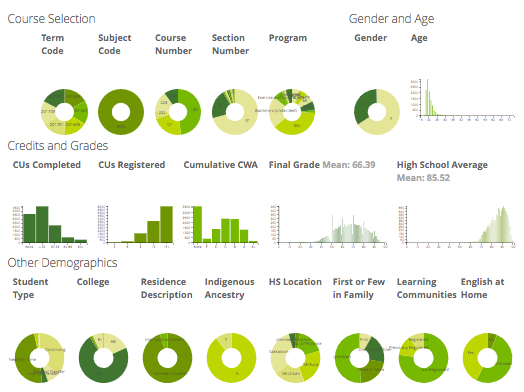
Know Your Students visualizes demographic data, but at the program level rather than the course level. It is intended for curriculum and program planning. It allows authorized users to view and drill down into data across a variety of variables, including student demographics, course, term, section, program, college enrolled, grade distribution, and more. Access to this dashboard requires permission of the Dean, Associate-Dean, or Vice-Dean of your College.
Questions This Answers
- What is the average grade (cumulative CWA) of students taking certain courses(s) in my department and who do NOT usually speak English at home?
- What are the characteristics (course load, International/domestic status, first in family, program enrolled, etc.) of students that are taking certain courses(s) in my program and have achieved final grades over 85% in those courses?
- What are the degree programs that students are enrolled in who are taking certain course(s) in my department?
Strengths
- Well organized graphics allow you to easily visualize a lot of data all at once for many students and courses.
- Great place to look for concerning differences between student groups that can then be investigated more thoroughly elsewhere.
Limitations
- Details can be lost in aggregation, so be careful not to read too deeply into what you see.
- Useful at the program level, not intended for use by individual instructors (see Know Your Class instead).
SLEQ is our centrally supported student course feedback tool. Reports are issued to instructors and academic leaders on a per-course basis. In addition, there is an archive of historical reports available to view feedback across several academic terms, giving insights into trends over time and progression towards specific teaching and learning goals.
Strengths
- College and Departments can create their own questions to give insight into whatever different aspects of the learning environment are uniquely important to them.
- The frequency and granularity of the questionnaires allow instructors to monitor their progress towards their specific teaching and learning goals, to identify aspects of the course that could benefit from extra attention.
- Mid-course SLEQ gives instructors an opportunity to adjust courses in progress to ensure that the learning experiences for their current students are as effective as can be.
Limitations
- Low response rates can adversely affect the validity of the data; instructors are encouraged to take actions to encourage their students to respond to the questionnaire to ensure it is as useful as possible.
- Reports are static, meaning that viewers cannot drill deeper into the report for more insights beyond what is shown.
In March 2022, the Office of Teaching and Learning with support from the Gwenna Moss Centre ran a Teaching Practices Survey to learn about instructional practices used by instructors, instructor beliefs about teaching, and their perceptions of the teaching climate. For academic units with high enough response rates, unit specific reports were written and shared with leaders. We plan to run this again in a few years to observe changes over time.
Questions This Answers
- How well do practices reported by instructors align with their beliefs about teaching and learning?
- Which specific practices are instructors reporting they use in their courses?
- What enablers and barriers exist at USask, with respect to teaching enhancement?
Strengths
- Hear information directly from instructors for an in-depth look at the instructor perspective on teaching and learning
- Identify gaps that exist between beliefs and practices, to adjust alignment of faculty support based on existing beliefs and practices
- Unit-specific reports enable units to compare their instructional practices to USask overall results, to help them identify areas for unit-led teaching enhancement efforts
Limitations
- Due to the nature of the survey, we are only able to run it once every few years, so the data is not quite as dynamic as other sources
- TPS 2022 was run during March 2022 and asked instructors to answer thinking of courses they taught in the past 2 years, meaning that many of the reported practices were for courses taught during the COVID-19 pandemic period
Learning Analytics in Action
When used to their fullest potential, learning analytics can lead to design choices and program changes that have a positive effect on the overall learning experience. Below you will find some fictional illustrative examples of how the systems mentioned in the previous section can be used to inform academic decision-making.
The Individual Instructor Scenario is an example of how any instructor could use analytics to support their teaching of an individual course.
The Program Design Scenario shows how analytics can be used to investigate program-level issues in the curriculum, in this case an attrition issue.
Student Data and Privacy
Student data are securely stored in the University Data Warehouse. Student data may be created by faculty, instructional staff, advisors, administrators, administrative and instructional systems, and by students themselves. Student data can include academic performance data, advising data, survey data, admissions and demographic data as well as activity data associated with university academic and administrative services (such as learning management systems, student response systems, network services, and card swipe systems). In addition, student data may include derived interpretations based on statistical models and patterns. Student data may be used for learning analytics with permission of the University Data Steward.
Student data for learning analytics does not include contents of email messages or other personal communications, discussion forum or social media postings, notes or written materials for which the student could claim copyright. Data of this type will not be used for learning analytics work without expressed written consent of the student.
Instructors in courses are not privy to their students’ personal or demographic data, nor to their students’ academic history outside the course or predictions of success within the course unless permission is given by the student. Instructors are not to discuss or disclose personal or academic information about students to other students or instructors. As such, instructors are limited in the scope of learning analytics work that they can do with their own students.
Academic advisors are granted special access to personal, demographic and academic history data about students, and they follow a strict code of conduct to ensure that students are protected. Academic advisors frequently participate in learning analytics work.
Get Help
Learning analytics work is supported jointly by The Office of Teaching and Learning and the Gwenna Moss Centre for Teaching and Learning.
To discuss using learning analytics in your college or department, please contact David Greaves, Teaching and Learning Enhancement Specialist.